 |
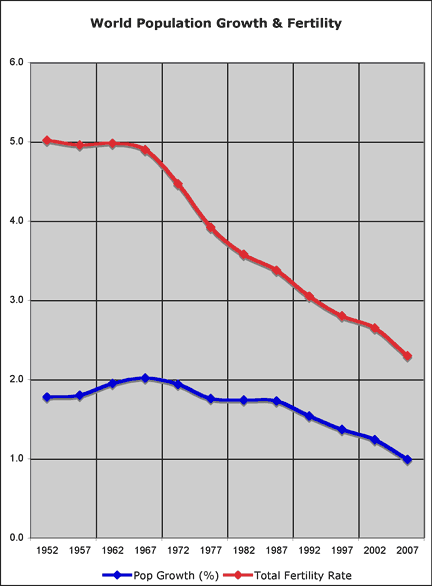
| Mid-Year | Pop Growth Rate (%) | Total Fertility Rate |
| 1952 | 1.78 | 5.02 |
| 1957 | 1.80 | 4.96 |
| 1962 | 1.95 | 4.98 |
| 1967 | 2.02 | 4.90 |
| 1972 | 1.94 | 4.47 |
| 1977 | 1.76 | 3.92 |
| 1982 | 1.74 | 3.58 |
| 1987 | 1.73 | 3.38 |
| 1992 | 1.54 | 3.05 |
| 1997 | 1.37 | 2.80 |
| 2002 | 1.24 | 2.65 |
| 2007 | 0.99 | 2.30 |
Total fertility rate = expected number of children per woman.
Data source: UN Population Prospects 2006.
Further reading: AAAS Atlas of Population and Environment.
Note 1: This chart was last updated in June, 2007. To see the orginal chart, click here.
Note 2: The figures for 2007 are estimates from the UN's "Low Variant" Projection, which assumes that fertility rates continue to decline towards an eventual equilibrium level of 1.85.